AdvancedJava Programming · Lesson 29 of 29 · Updated ·
JVM Memory and Garbage Collection in Java — Heap, Stack, Metaspace and GC
"Explain JVM memory" and "When is an object eligible for garbage collection?" are among the most asked Java interview questions, from service companies to product companies. Knowing the answer also helps you fix real problems: a StackOverflowError from deep recursion, or a server that slows down and finally crashes with OutOfMemoryError. Earlier lessons showed the basic stack and heap picture; this lesson goes one level deeper.
1. The memory areas of the JVM
When you run java Main, the JVM divides its memory into several areas. The two you meet every day are the heap and the stacks.
| Area | One per | Holds | Error when full |
|---|---|---|---|
| Heap | JVM (shared by all threads) | every object and array, including their fields | OutOfMemoryError: Java heap space |
| Stack | thread | method frames: local variables, parameters, references | StackOverflowError |
| Metaspace | JVM | class information: method code, field names, constant pool | OutOfMemoryError: Metaspace |
| PC register | thread | address of the current instruction | — |
| Native method stack | thread | frames of native (C/C++) methods | — |
Two details interviewers like:
- A local variable of a class type (like
Student s) lives on the stack, but it holds only a reference. TheStudentobject itself is always on the heap. - Since Java 8, class metadata lives in Metaspace, which uses native memory and replaced the older "PermGen" area. Static variables are stored with the class's data on the heap, not on a thread's stack.
2. Stack frames and StackOverflowError
Every method call pushes a frame onto the calling thread's stack. The frame holds that call's parameters and local variables. When the method returns, its frame is popped and those variables are gone. This is why local variables need no garbage collection and why each thread can use its own locals safely.
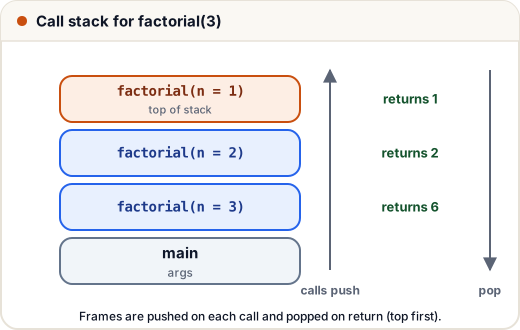
The stack has a fixed size (often around 512 KB to 1 MB per thread by default, depending on the platform; set with -Xss). Recursion with no base case keeps pushing frames until the stack is full.
public class Main {
    static int depth = 0;

    static int factorial(int n) {
        if (n <= 1) return 1;                 // base case: stop pushing frames
        return n * factorial(n - 1);
    }

    static void forever() {
        depth++;
        forever();                            // no base case
    }

    public static void main(String[] args) {
        System.out.println(factorial(5));
        try {
            forever();
        } catch (StackOverflowError e) {
            System.out.println("StackOverflowError after many frames: " + (depth > 1000));
        }
    }
}
120
StackOverflowError after many frames: true
The exact depth reached varies with the JVM, platform and settings, so the program only checks that it is large. In practice, fix a StackOverflowError by correcting the base case or turning deep recursion into a loop — not by catching it.
3. When is an object eligible for garbage collection?
The garbage collector (GC) frees heap memory used by objects the program can no longer reach. It does not count references. It starts from GC roots and marks everything reachable; whatever is not marked is garbage.
GC roots include:
- local variables and parameters in the frames of live threads,
- static fields of loaded classes,
- active threads themselves, and a few JVM-internal references.
An object becomes eligible for GC when no chain of references from a root reaches it. Common ways this happens: setting the last reference to null, pointing the variable to another object, or the method that held the only reference returning.
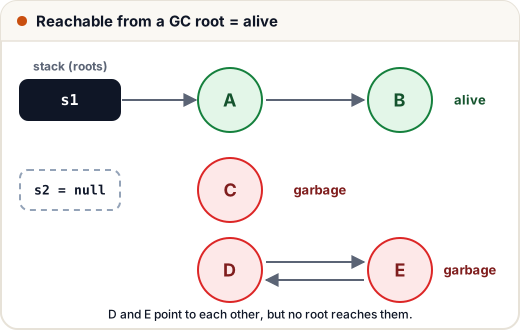
Note objects D and E in the picture: they refer to each other, but nothing from a root reaches them, so both are collected. This is why Java has no problem with reference cycles, unlike simple reference counting.
The classic interview question
class Box {
    String label;
    Box next;
    Box(String label) { this.label = label; }
}

public class Main {
    public static void main(String[] args) {
        Box a = new Box("A");
        Box b = new Box("B");
        Box c = new Box("C");
        a.next = b;          // A -> B
        b = null;            // B still reachable through a.next
        c = a;               // C has no reference now: eligible
        a = null;            // A still reachable through c
        System.out.println(c.label + " -> " + c.next.label);
    }
}
A -> B
After the last assignment, only one object (C) is eligible. A is reachable through c, and B through c.next. Count by following references from the live variables, not by counting = null lines.
Being eligible does not mean the object is freed now. The GC runs when the JVM decides it is needed. System.gc() is only a request that the JVM may ignore. The old finalize() method is deprecated and should not be used; use try-with-resources to release files and connections.
4. Generational garbage collection
In most real programs, most objects die young: a temporary String or an iterator lives for microseconds. So the HotSpot JVM splits the heap into generations and collects the young part often and cheaply.
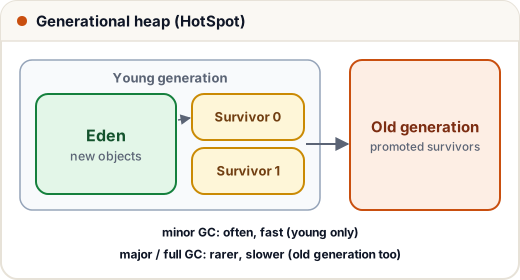
| Step | What happens |
|---|---|
| 1 | New objects are created in Eden (part of the young generation). |
| 2 | When Eden fills, a minor GC runs. Live objects are copied to a survivor space; everything else in Eden is freed at once. |
| 3 | Each survival increases an object's age. After surviving enough minor GCs, it is promoted to the old generation. |
| 4 | When the old generation fills, a larger (major or full) collection runs, which takes longer. |
Most collectors must sometimes pause the application threads ("stop-the-world") for parts of their work. Different collectors balance pause time against throughput:
| Collector | Notes |
|---|---|
G1 (-XX:+UseG1GC) | default in server JVMs since Java 9; splits the heap into regions; aims for short, predictable pauses |
| Parallel | many threads, best total throughput, longer pauses |
| Serial | single thread, for small heaps and small machines |
| ZGC / Shenandoah | very short pauses even on large heaps (production-ready in newer JDKs) |
5. Memory leaks still happen
GC frees only unreachable objects. If your code keeps a reference to objects it no longer needs, they stay forever. This is a memory leak in Java. The most common cause is a collection that only grows, often a static one, because static fields are GC roots.
import java.util.*;

public class Main {
    static final List<byte[]> CACHE = new ArrayList<>();   // static: a GC root

    static void handleRequest(int id) {
        byte[] report = new byte[1024];                    // 1 KB per request
        CACHE.add(report);                                 // leak: never removed
    }

    public static void main(String[] args) {
        for (int i = 0; i < 5000; i++) handleRequest(i);
        System.out.println("cached reports: " + CACHE.size() + " (~" + CACHE.size() / 1024 + " MB kept alive)");
        CACHE.clear();                                     // fix: remove or bound the cache
        System.out.println("after clear: " + CACHE.size());
    }
}
cached reports: 5000 (~4 MB kept alive)
after clear: 0
Other common leaks: listeners that are registered but never removed, ThreadLocal values in thread pools that are never cleared, and unbounded maps used as caches. Use a size limit, remove entries when done, or use a proper cache library.
6. Settings and tools
| Flag | Meaning |
|---|---|
-Xms512m | starting heap size |
-Xmx2g | maximum heap size |
-Xss1m | stack size per thread |
-XX:+HeapDumpOnOutOfMemoryError | write a heap dump file when the heap runs out, for analysis |
Tools that ship with the JDK — jcmd, jstat and JDK Mission Control — and the free VisualVM show heap use and GC activity of a running program. From code, Runtime.getRuntime() reports the current numbers:
public class Main {
    public static void main(String[] args) {
        Runtime rt = Runtime.getRuntime();
        long max = rt.maxMemory(), total = rt.totalMemory(), free = rt.freeMemory();
        System.out.println("free <= total <= max: " + (free <= total && total <= max));
        try {
            int[] huge = new int[Integer.MAX_VALUE];
        } catch (OutOfMemoryError e) {
            System.out.println("caught " + e.getClass().getSimpleName());
        }
    }
}
free <= total <= max: true
caught OutOfMemoryError
The actual sizes depend on your computer and flags, so the program prints only how they relate. OutOfMemoryError is an Error, not an Exception: normal code should not catch it, but you should know its causes.
Common mistakes
- Saying "objects are on the stack". Only primitives and references in local variables are; objects are always on the heap.
- Counting
= nulllines to answer GC questions instead of following references from live variables. - Believing
System.gc()forces a collection right away. - Thinking reference cycles cause leaks in Java. They do not; reachability from roots is what matters.
- Thinking Java cannot leak memory. Growing static collections and forgotten listeners do.
- Raising
-Xmxto "fix" a leak; it only delays the crash.
Quick recap
- Heap (shared): objects. Stack (per thread): frames with locals. Metaspace: class metadata.
- Too deep recursion →
StackOverflowError; heap full →OutOfMemoryError. - An object is eligible for GC when no GC root (locals, statics, live threads) can reach it; cycles do not matter.
- Generational GC: Eden → survivor → old; minor GCs are frequent and cheap.
- G1 is the usual default;
System.gc()is just a request. - Leaks come from references you keep, such as static collections.