Quantitative Aptitude · Lesson 18 of 18 · Updated ·
Data Interpretation — Bar Graphs, Tables and Pie Charts
Data Interpretation (DI) gives you a chart or table and 4–5 questions on it. It tests percentages, ratios and averages — everything from earlier lessons — on real-looking data.
The 4-step method
- Read the title, units and labels first. "In hundreds"? "In ₹ lakh"? "Percentage of total"? Missing the unit is the most common mistake.
- Read the question carefully. Which year? Which item? Growth from what to what?
- Write down only the numbers you need.
- Approximate when the options are far apart.
1. Bar graphs
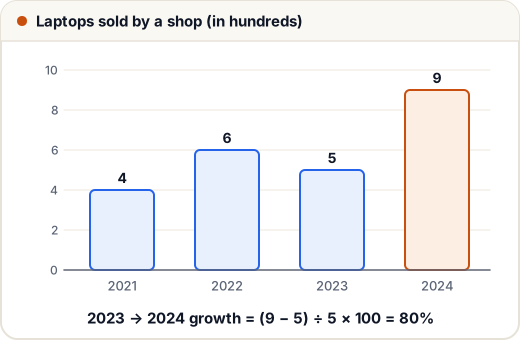
Use the chart above for these:
Example 1
How many laptops were sold in total in the four years?
(4 + 6 + 5 + 9) hundred = 24 hundred = 2,400.
Example 2
What is the percentage growth from 2023 to 2024?
(9 − 5) ÷ 5 × 100 = 80%. (Divide by the earlier year.)
Example 3
In which year was the percentage change from the previous year the largest?
- 2022: +2 on 4 = +50%
- 2023: −1 on 6 = −16.7%
- 2024: +4 on 5 = +80% → 2024
Example 4
What is the average number sold per year? 2,400 ÷ 4 = 600.
2. Tables
| Department | Employees | Women (%) |
|---|---|---|
| Sales | 200 | 30% |
| Tech | 300 | 25% |
| HR | 50 | 60% |
Example 5
How many women work in Tech? 25% of 300 = 75.
Example 6
What percentage of all employees are women?
Women: 60 + 75 + 30 = 165. All: 550. 165 ÷ 550 × 100 = 30%.
(Notice it is not the average of 30, 25 and 60 — the departments are different sizes.)
3. Pie charts
A pie chart shows parts of a whole. The whole circle is 100% or 360°.
Angle = (percentage ÷ 100) × 360°, so 1% = 3.6°.
Example 7
A family spends ₹40,000 a month. Rent is 25% of the pie. How much is rent, and what angle is its slice?
Rent = 25% of 40,000 = ₹10,000. Angle = 25 × 3.6 = 90°.
Example 8
In the same pie, food is 72°. What is the food budget?
72° ÷ 3.6 = 20% → 20% of 40,000 = ₹8,000.
4. Line graphs
A line graph shows a value over time. The steepest upward segment is the biggest absolute increase — but not always the biggest percentage increase (a rise of 10 on a base of 20 is 50%, but a rise of 15 on 100 is only 15%).
Speed tips
- Ratios and comparisons often need no calculation — compare the bars by eye first.
- For "approximately", round to easy numbers.
- If several questions use the same total, calculate it once and write it down.
Common mistakes
- Ignoring units ("in hundreds", "in lakhs").
- Dividing by the later value in growth % (always divide by the earlier value).
- Averaging percentages from groups of different sizes.
Quick recap
- Title, units, labels → question → numbers → approximate.
- Growth % = change ÷ earlier value × 100.
- Pie: 100% = 360°, 1% = 3.6°.
- Combined % = total part ÷ total whole, not the average of the %s.