AdvancedCloud & DevOps · Lesson 13 of 14 · Updated ·
Load Testing and Capacity Planning — Little's Law, Utilisation, Percentiles and Autoscaling
Every Indian student has seen it: results are announced, everyone opens the website at 10:00, and it shows an error. The servers were not "bad"; nobody measured how much traffic they could take and planned for the peak. Capacity planning answers two questions: how much load can our system handle? and how much will we need, and when? Load testing is how you get real numbers instead of guesses.
1. The words you need
| Term | Meaning | Example |
|---|---|---|
| Throughput | work done per second | 1,200 requests per second (RPS) |
| Latency | time for one request | 250 ms |
| p95 latency | 95% of requests are faster than this | p95 = 400 ms |
| Concurrency | requests in progress at the same moment | 300 in flight |
| Utilisation | how busy a resource is | CPU at 60% |
| Headroom | spare capacity kept for surprises | 40% |
Averages hide pain. If 95 requests take 100 ms and 5 take 3 seconds, the average is 245 ms, which looks fine, but 1 in 20 students waits 3 seconds. That is why teams track percentiles.
2. Little's Law: connecting the numbers
Little's Law is a simple rule that holds for any stable system:
requests in flight = arrival rate × time each request spends inside
If 1,200 requests arrive per second and each takes 0.25 seconds, about 300 requests are inside the system at any moment. That tells you how many worker threads, database connections or Lambda instances you need. Combine it with a load-test measurement of one server to size the whole fleet:
import math

peak_rps = 1200                 # expected at 10:00 on result day
avg_time_s = 0.25               # measured average time per request
per_server_rps = 150            # one server's limit, found by load testing
target_utilisation = 0.6        # plan to run at 60%, keeping 40% headroom

in_flight = peak_rps * avg_time_s
servers = math.ceil(peak_rps / (per_server_rps * target_utilisation))
print("requests in flight:", in_flight)
print("servers needed at 60% utilisation:", servers)
print("with one spare for failures (N+1):", servers + 1)
requests in flight: 300.0
servers needed at 60% utilisation: 14
with one spare for failures (N+1): 15
The extra server is the N+1 rule: if one server dies during the peak, the rest can still carry the load.
3. Why not run servers at 100%?
It is tempting to say "one server does 150 RPS, so 8 servers handle 1,200". The problem is queueing. Requests do not arrive evenly; they come in bursts. As a server gets busier, a burst finds it already working, and requests wait in a queue. The waiting grows slowly at first and then explodes.
A classic queueing model (called M/M/1: one server, random arrivals, random service times) gives the average time in the system as 1 / (service rate − arrival rate). For a server that can handle 100 requests per second:
service_rate = 100              # requests per second the server can handle

for utilisation in [0.5, 0.7, 0.8, 0.9, 0.95, 0.99]:
    arrival_rate = service_rate * utilisation
    time_ms = 1000 / (service_rate - arrival_rate)
    print(f"{utilisation:.0%} busy -> average time {time_ms:.0f} ms")
50% busy -> average time 20 ms
70% busy -> average time 33 ms
80% busy -> average time 50 ms
90% busy -> average time 100 ms
95% busy -> average time 200 ms
99% busy -> average time 1000 ms
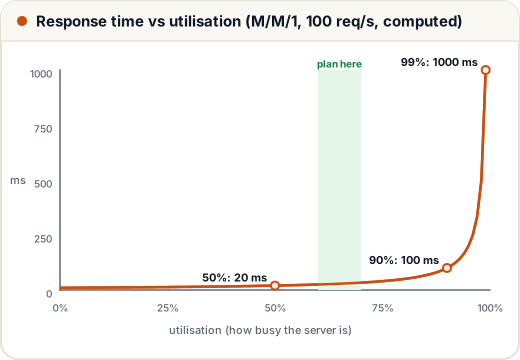
Going from 50% to 90% busy makes requests 5 times slower; from 90% to 99%, another 10 times. Real systems are messier than this model, but the shape is the same everywhere. That is why plans target around 60–70% utilisation at peak, not 100%.
4. The four kinds of load test
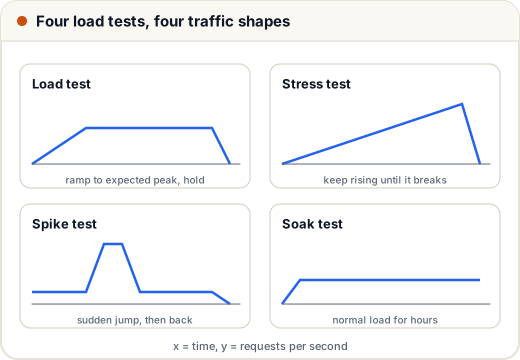
| Test | Question it answers | Typical finding |
|---|---|---|
| Load test | Do we meet our latency target at the expected peak? | p95 = 380 ms at 1,200 RPS: pass |
| Stress test | Where and how do we break? | database connections run out at 1,900 RPS |
| Spike test | What happens when traffic jumps suddenly? | autoscaling takes 4 minutes; errors meanwhile |
| Soak test | Does anything degrade over hours? | memory leak: restarts after 6 hours |
Common tools: k6 and Locust (tests written as code), Apache JMeter (GUI and XML plans), wrk and hey (quick command-line tests). Some rules:
- Test a staging environment sized like production, with realistic data (a query that is fast on 100 rows may be slow on 10 lakh rows).
- Generate load from outside the servers you are testing, or the load generator steals their CPU.
- Use realistic user journeys: login, open the result page, download a PDF, not one URL hit a million times.
- Never load test a website you do not own or have written permission to test; it can look exactly like an attack.
5. Reading the results
After a test, look at percentiles and errors together. Here is how a tool computes p50, p95 and p99 from measured latencies (nearest-rank method):
import math

latencies_ms = [120, 95, 140, 110, 3000, 130, 105, 125, 150, 98,
                115, 135, 102, 2800, 128, 118, 108, 142, 99, 122]

def percentile(values, p):
    ordered = sorted(values)
    rank = math.ceil(p / 100 * len(ordered))      # nearest-rank method
    return ordered[rank - 1]

print("average:", sum(latencies_ms) / len(latencies_ms), "ms")
for p in (50, 95, 99):
    print(f"p{p}: {percentile(latencies_ms, p)} ms")
average: 397.1 ms
p50: 120 ms
p95: 2800 ms
p99: 3000 ms
The median request is fast (120 ms), but the slow tail is very slow. The average (397 ms) describes nobody's real experience. When you see a tail like this, look for the cause: a slow database query, garbage-collection pauses, or a cold cache.
6. Autoscaling with care
Autoscaling (adding servers automatically when load rises, lesson 6 and lesson 7) helps, but it is not instant:
- A new server needs time to start, warm up and pass health checks, often a few minutes. A spike can be over before help arrives.
- Scale on a signal that rises before users suffer: CPU around 60%, request count per server, or queue length.
- For predictable peaks (result day, a sale at 12:00, a class at 19:00), use scheduled scaling: add capacity 30 minutes before.
- Set a maximum so a bug or an attack cannot create a huge bill, and remember the database usually does not autoscale like app servers do.
7. Case study: result day
A state exam portal expects 1,200 RPS at 10:00. The team:
- Measures one server with a load test: 150 RPS with p95 under 500 ms. Beyond that, p95 shoots past 2 seconds.
- Sizes with Little's Law and 60% target utilisation: 14 servers, plus 1 spare, so 15. The database needs about 300 connections, so they add a connection pooler.
- Caches the result page at the CDN for a minute (results do not change once published), which removes most of the load.
- Runs a spike test to 2× the forecast in staging and a soak test overnight.
- Schedules scaling to 15 servers at 09:30, and keeps a "high traffic" page ready in case everything else fails.
On the day the site stays up. The CDN served most page views, so the servers ran at about 35%, which is a comfortable, cheaper problem to have next year.
Common mistakes
- Planning from averages instead of peak traffic and p95/p99 latency.
- Planning to run at 90–100% utilisation, ignoring queueing.
- Load testing a tiny staging setup with an empty database.
- Trusting autoscaling for sudden spikes without scheduled scaling or warm capacity.
- Forgetting the database and connection limits while scaling app servers.
Quick recap
- Throughput, latency percentiles, concurrency, utilisation and headroom describe capacity.
- Little's Law: in flight = arrival rate × time inside.
- Servers needed = peak ÷ (per-server limit × target utilisation), plus one spare.
- Latency grows slowly then explodes near 100% busy; target about 60–70% at peak.
- Load, stress, spike and soak tests answer different questions; autoscale early, schedule for known peaks, cap the maximum.