Cloud & DevOps · Lesson 9 of 9 · Updated ·
Monitoring, SRE and a Real Deployment — Metrics, Logs, SLOs, Alerts and Shipping a Web App End to End
Shipping is not the finish line. Once real users arrive, you need to know — before they tell you — when something is slow or broken. That's monitoring and observability, and the discipline built around it is Site Reliability Engineering (SRE), started at Google and now common everywhere.
1. The three pillars of observability
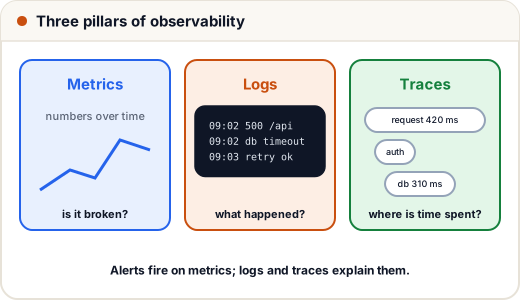
| Pillar | What | Answers | Tools |
|---|---|---|---|
| Metrics | numbers over time | is something wrong? (error rate up, latency up) | Prometheus + Grafana, CloudWatch, Datadog |
| Logs | detailed event records | what exactly happened? | Loki, ELK/OpenSearch, CloudWatch Logs |
| Traces | one request's journey across services | where is the time spent? | OpenTelemetry, Jaeger, Tempo |
2. The four golden signals
If you can only watch four things for a service, watch these:
| Signal | Example |
|---|---|
| Latency | p95 response time 280 ms (watch slow and failed requests) |
| Traffic | 1,200 requests/minute |
| Errors | 0.4% of requests return 5xx |
| Saturation | CPU 75%, memory 82%, disk 91%, queue length |
Use percentiles, not averages: an average of 200 ms can hide that 5% of students wait 4 seconds. p95 = 95% of requests are faster than this.
3. SLIs, SLOs and error budgets
- SLI (indicator) — a measurement: % of requests that succeed in under 500 ms.
- SLO (objective) — the target: 99.9% over 30 days.
- SLA (agreement) — a promise to customers with penalties (usually looser than the SLO).
- Error budget — what the SLO allows to fail: 100% − 99.9% = 0.1%.
The error budget turns reliability into a decision tool: while budget remains, ship features quickly; when it's used up, focus on reliability.
def allowed_downtime_minutes(slo, days=30):
    return round((1 - slo) * days * 24 * 60, 1)

for slo in [0.99, 0.995, 0.999, 0.9999]:
    print(f"SLO {slo:.2%}: {allowed_downtime_minutes(slo)} minutes of failure allowed per 30 days")

# this month: 2,500,000 requests, 1,900 failed
total, failed, slo = 2_500_000, 1_900, 0.999
budget = (1 - slo) * total
print(f"\nSuccess rate: {(total - failed) / total:.4%}")
print(f"Error budget: {budget:.0f} failed requests, used {failed / budget:.0%}")
SLO 99.00%: 432.0 minutes of failure allowed per 30 days
SLO 99.50%: 216.0 minutes of failure allowed per 30 days
SLO 99.90%: 43.2 minutes of failure allowed per 30 days
SLO 99.99%: 4.3 minutes of failure allowed per 30 days

Success rate: 99.9240%
Error budget: 2500 failed requests, used 76%
Each extra "9" cuts allowed failure by 10×, and costs a lot more engineering — choose SLOs your users actually need.
4. Alerting that people don't ignore
- Alert on symptoms users feel (error rate, latency, SLO burn) rather than every cause (CPU at 81%).
- Every page must be actionable and link to a runbook ("if this fires, check X, then Y").
- Use severities: page someone for "users affected now"; ticket for "fix this week" (disk will fill in 5 days).
- Too many alerts → alert fatigue → real alerts get ignored.
Example rules: page if 5xx > 2% for 5 minutes; page if p95 latency > 1 s for 10 minutes; ticket if disk > 80%; page if the health check fails from two locations.
5. Incidents and postmortems
When things break: detect → acknowledge → mitigate first (roll back, scale up, fail over) → fix → write a postmortem.
A blameless postmortem records the timeline, impact, root cause(s), what went well, and action items with owners — "the deploy pipeline will block if the health check fails" rather than "Ravi should be more careful". Systems should make the right thing easy.
6. Case study: deploying a web app end to end
Let's put the whole track together: a Next.js/Node app with PostgreSQL on a single Ubuntu VPS — a realistic, low-cost setup used by many Indian startups (Skills101 runs a very similar one).
1. Server setup (once, ideally scripted)
- Ubuntu LTS, a non-root
deployuser, SSH keys only, firewall allowing 22/80/443,fail2ban, automatic security updates. - PostgreSQL listening on localhost only; app user with privileges on its own database only; nightly
pg_dumpbackups copied off the server.
2. nginx as reverse proxy with HTTPS
server {
    listen 443 ssl;
    server_name example.in;
    ssl_certificate     /etc/letsencrypt/live/example.in/fullchain.pem;
    ssl_certificate_key /etc/letsencrypt/live/example.in/privkey.pem;
    add_header Strict-Transport-Security "max-age=31536000" always;

    location / {
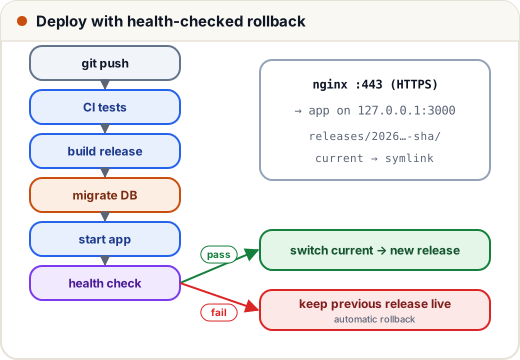
        proxy_pass http://127.0.0.1:3000;
        proxy_set_header Host $host;
        proxy_set_header X-Forwarded-For $proxy_add_x_forwarded_for;
        proxy_set_header X-Forwarded-Proto $scheme;
    }
}
Certificates from Let's Encrypt with certbot, renewing automatically.
3. Releases with instant rollback
Each deploy goes into a new folder releases/20261110-0930-<sha>; a symlink current points at the live one. The deploy script: build → run migrations → start/reload the process manager (systemd or PM2) → curl the health endpoint → if it fails, point current back at the previous release and reload. Old releases are kept for a few days.
4. CI/CD
GitHub Actions runs lint and tests on every PR (lesson 5); merging to protected main triggers the deploy job over SSH.
5. Monitoring
- An external uptime check on
/healthevery minute (alerts to phone/WhatsApp). - Application logs to journald/PM2 logs with rotation; nginx access logs analysed with the commands from lesson 2.
- Disk, memory and CPU alerts; backup-success check; certificate-expiry check.
When traffic outgrows one server, the same pieces map onto the cloud: load balancer + multiple instances or Kubernetes, managed database, CDN — exactly the architecture from lesson 7.
7. DevOps career roadmap
| Stage | Learn | Build to show |
|---|---|---|
| 1 | Linux, Git, bash, networking basics | a server you set up and harden yourself |
| 2 | Docker + Compose | your college project running with one command |
| 3 | CI/CD (GitHub Actions) | tests + deploy on every push |
| 4 | One cloud (AWS) | the architecture from lesson 7 with a billing alarm |
| 5 | Kubernetes | app on minikube/kind with probes and HPA |
| 6 | Terraform + monitoring | infra in code, Grafana dashboard, documented runbook |
Write up each project in a README with a diagram — it doubles as interview material. Typical interview questions: explain what happens when you type a URL, container vs VM, how would you deploy with zero downtime, a pod is in CrashLoopBackOff — what do you do, how do you handle secrets.
Common mistakes
- Monitoring only CPU and calling it done; no user-facing signals.
- Alerts with no runbook, or so many that nobody reads them.
- Backups that are never test-restored ("we have backups" ≠ "we can restore").
- Blaming people in postmortems instead of fixing systems.
Quick recap
- Observability = metrics, logs, traces; watch the golden signals with percentiles.
- SLI measures, SLO targets, error budget = what may fail; each extra nine costs 10× less failure allowed.
- Alert on user-facing symptoms, keep alerts actionable with runbooks.
- Incidents: mitigate first, blameless postmortem after.
- A solid small deployment: hardened Linux + nginx/HTTPS + release folders with health-checked rollback + CI/CD + monitoring + off-site backups.