AdvancedDBMS & SQL · Lesson 19 of 25 · Updated ·
SQL for Data Analysis — Conditional Aggregation, Pivots, Percentages and Funnels
Analyst and business-analyst interviews rarely ask "write a SELECT". They ask "show category-wise sales per city as columns", "what share of revenue came from each city?", "how many users dropped off at each step?". These are a handful of patterns built from GROUP BY and CASE. Learn the patterns once and you can answer most such questions.
CREATE TABLE orders (order_id INT PRIMARY KEY, customer VARCHAR(20), city VARCHAR(20), category VARCHAR(20), order_date DATE, amount INT, status VARCHAR(10));
INSERT INTO orders VALUES
 (1, 'Asha', 'Jaipur', 'Books', '2026-01-05', 450, 'delivered'), (2, 'Ravi', 'Pune', 'Electronics', '2026-01-09', 2200, 'delivered'),
 (3, 'Neha', 'Jaipur', 'Electronics', '2026-01-17', 1800, 'returned'), (4, 'Kabir', 'Delhi', 'Books', '2026-01-23', 300, 'delivered'),
 (5, 'Asha', 'Jaipur', 'Clothes', '2026-02-02', 900, 'delivered'), (6, 'Om', 'Pune', 'Books', '2026-02-11', 250, 'cancelled'),
 (7, 'Ravi', 'Pune', 'Clothes', '2026-02-14', 1200, 'delivered'), (8, 'Meera', 'Delhi', 'Electronics', '2026-02-20', 3100, 'delivered'),
 (9, 'Neha', 'Jaipur', 'Books', '2026-03-03', 600, 'delivered'), (10, 'Kabir', 'Delhi', 'Clothes', '2026-03-08', 700, 'returned'),
 (11, 'Asha', 'Jaipur', 'Electronics', '2026-03-15', 1500, 'delivered'), (12, 'Om', 'Pune', 'Clothes', '2026-03-28', 800, 'delivered');
1. Conditional aggregation: CASE inside SUM and COUNT
Put a CASE inside an aggregate to count or add only some rows — several different filters in one pass over the table.
SELECT city,
       COUNT(*) AS orders,
       SUM(CASE WHEN status = 'delivered' THEN 1 ELSE 0 END) AS delivered,
       SUM(CASE WHEN status = 'returned' THEN 1 ELSE 0 END) AS returned,
       SUM(CASE WHEN status = 'delivered' THEN amount ELSE 0 END) AS revenue
FROM orders GROUP BY city ORDER BY revenue DESC;
city | orders | delivered | returned | revenue
Pune | 4 | 3 | 0 | 4200
Jaipur | 5 | 4 | 1 | 3450
Delhi | 3 | 2 | 1 | 3400
Why not three separate queries with WHERE? Because each would scan the table again, and you would still have to combine the results. One GROUP BY with conditional sums gives one neat row per city.
COUNT(CASE WHEN … THEN 1 END) also works: with no ELSE, the CASE gives NULL, and COUNT skips NULLs. PostgreSQL and SQLite also accept the shorter COUNT(*) FILTER (WHERE status = 'returned').
2. Pivot: rows into columns
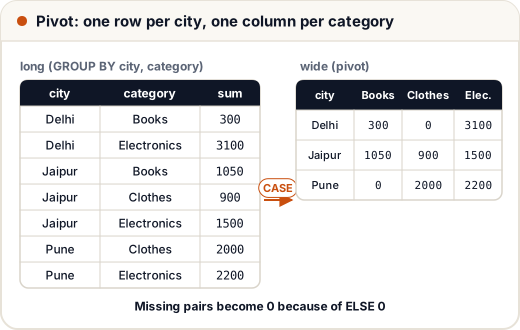
Long data has one row per (city, category). A pivot turns the categories into columns — the shape managers want in a report.
SELECT city,
       SUM(CASE WHEN category = 'Books' THEN amount ELSE 0 END) AS books,
       SUM(CASE WHEN category = 'Clothes' THEN amount ELSE 0 END) AS clothes,
       SUM(CASE WHEN category = 'Electronics' THEN amount ELSE 0 END) AS electronics
FROM orders WHERE status = 'delivered'
GROUP BY city ORDER BY city;
city | books | clothes | electronics
Delhi | 300 | 0 | 3100
Jaipur | 1050 | 900 | 1500
Pune | 0 | 2000 | 2200
It is the same conditional aggregation, with one CASE per output column. SQL Server and Oracle have a PIVOT keyword, but this CASE version works in every database, so interviewers usually expect it. Its limit: you must know the column values (Books, Clothes, Electronics) when you write the query.
Unpivot goes the other way — columns back into rows — with UNION ALL:
WITH wide AS (
    SELECT 'Jaipur' AS city, 1050 AS books, 900 AS clothes
)
SELECT city, 'Books' AS category, books AS amount FROM wide
UNION ALL
SELECT city, 'Clothes', clothes FROM wide;
city | category | amount
Jaipur | Books | 1050
Jaipur | Clothes | 900
3. Share of total (percentages)
"What percentage of delivered revenue came from each city?" Divide each group by the grand total. A window function over the grouped result gives the total without a second query:
SELECT city, SUM(amount) AS revenue,
       ROUND(100.0 * SUM(amount) / SUM(SUM(amount)) OVER (), 1) AS pct
FROM orders WHERE status = 'delivered'
GROUP BY city ORDER BY revenue DESC;
city | revenue | pct
Pune | 4200 | 38.0
Jaipur | 3450 | 31.2
Delhi | 3400 | 30.8
SUM(SUM(amount)) OVER () looks odd but reads simply: the inner SUM is each city's total; the outer SUM with an empty OVER () adds those totals across all groups. The 100.0 avoids integer division.
Return rate is a ratio inside each group:
SELECT category,
       ROUND(100.0 * SUM(CASE WHEN status = 'returned' THEN 1 ELSE 0 END) / COUNT(*), 1) AS return_pct
FROM orders GROUP BY category ORDER BY return_pct DESC, category;
category | return_pct
Clothes | 25.0
Electronics | 25.0
Books | 0.0
4. Trends by month
Group by a truncated date. In SQLite strftime('%Y-%m', d), in MySQL DATE_FORMAT(d, '%Y-%m'), in PostgreSQL DATE_TRUNC('month', d).
SELECT strftime('%Y-%m', order_date) AS month,
       COUNT(*) AS orders,
       SUM(CASE WHEN status = 'delivered' THEN amount ELSE 0 END) AS revenue
FROM orders GROUP BY month ORDER BY month;
month | orders | revenue
2026-01 | 4 | 2950
2026-02 | 4 | 5200
2026-03 | 4 | 2900
Add LAG to get month-on-month growth:
WITH m AS (
    SELECT strftime('%Y-%m', order_date) AS month, SUM(amount) AS revenue
    FROM orders WHERE status = 'delivered' GROUP BY month
)
SELECT month, revenue,
       ROUND(100.0 * (revenue - LAG(revenue) OVER (ORDER BY month)) / LAG(revenue) OVER (ORDER BY month), 1) AS growth_pct
FROM m ORDER BY month;
month | revenue | growth_pct
2026-01 | 2950 | NULL
2026-02 | 5200 | 76.3
2026-03 | 2900 | -44.2
February grew 76.3% over January's 2950; March fell 44.2%, which shows as a negative number. The first month has no previous month, so its growth is NULL — not 0.
5. Subtotals and a grand total
MySQL, PostgreSQL, SQL Server and Oracle can add subtotal rows with GROUP BY ROLLUP(city). A portable way that works everywhere (including SQLite) is UNION ALL of the detail and the total:
SELECT city, SUM(amount) AS revenue FROM orders WHERE status = 'delivered' GROUP BY city
UNION ALL
SELECT 'ALL CITIES', SUM(amount) FROM orders WHERE status = 'delivered';
city | revenue
Delhi | 3400
Jaipur | 3450
Pune | 4200
ALL CITIES | 11050
6. Funnel: where do users drop off?
A learning website tracks steps: visit → sign up → take a test → pay. A funnel counts how many users reached each step and the conversion from the step before.
CREATE TABLE events (user_id INT, step VARCHAR(10));
INSERT INTO events VALUES (1, 'visit'), (2, 'visit'), (3, 'visit'), (4, 'visit'), (5, 'visit'), (6, 'visit'), (7, 'visit'), (8, 'visit'),
 (1, 'signup'), (2, 'signup'), (3, 'signup'), (5, 'signup'), (7, 'signup'),
 (1, 'test'), (2, 'test'), (5, 'test'), (1, 'paid'), (5, 'paid');

WITH f AS (
    SELECT COUNT(DISTINCT CASE WHEN step = 'visit' THEN user_id END) AS visit,
           COUNT(DISTINCT CASE WHEN step = 'signup' THEN user_id END) AS signup,
           COUNT(DISTINCT CASE WHEN step = 'test' THEN user_id END) AS test,
           COUNT(DISTINCT CASE WHEN step = 'paid' THEN user_id END) AS paid
    FROM events
)
SELECT visit, signup, test, paid,
       ROUND(100.0 * signup / visit, 1) AS signup_pct,
       ROUND(100.0 * paid / visit, 1) AS overall_pct
FROM f;
visit | signup | test | paid | signup_pct | overall_pct
8 | 5 | 3 | 2 | 62.5 | 25.0
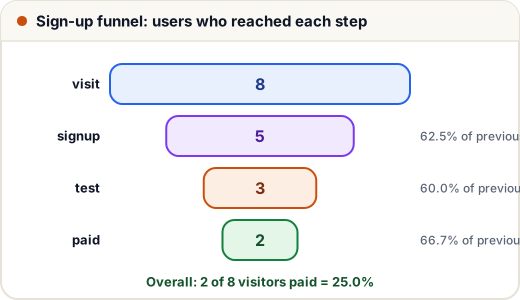
COUNT(DISTINCT …) matters: if a user takes two tests, they must still count once.
Common mistakes
- Using
ELSE 0insideCOUNT(CASE …). COUNT counts the 0s too — use SUM with ELSE 0, or COUNT with no ELSE. - Integer division:
100 * 3 / 8gives 37 in many databases. Write100.0 *. - Mixing filters: putting
WHERE status = 'delivered'in a query where you also want to count returned orders. Use CASE instead. - Showing growth from 0 or NULL as 0%. If the previous value is missing, the growth is unknown.
- Counting events instead of users in a funnel. Use COUNT(DISTINCT user_id).
Quick recap
SUM(CASE WHEN cond THEN x ELSE 0 END)= many filtered totals in one pass.- Pivot = one conditional SUM per output column; unpivot = UNION ALL.
- Share of total:
100.0 * SUM(x) / SUM(SUM(x)) OVER (). - Month trends: group by a truncated date; growth with LAG.
- Subtotals: ROLLUP where supported, or UNION ALL a total row; funnels with COUNT(DISTINCT CASE …).