Python for Data Science & Machine Learning · Lesson 5 of 12 · Updated ·
Analysing Data with pandas — groupby, Aggregations, merge (Joins) and Pivot Tables
Cleaning gets data ready; groupby and merge turn it into answers. These two operations are 80% of day-to-day analysis — and they're exactly SQL's GROUP BY and JOIN (see DBMS & SQL).
Case study: the placement cell's report
The Training & Placement Officer wants a one-page report for the principal: placement rate and average package by branch, and which companies hire most. Data comes from two tables: students and offers.
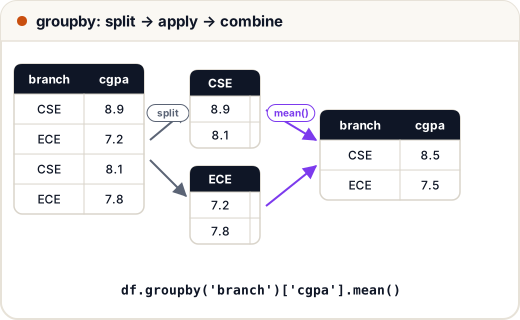
1. groupby: split → apply → combine
import pandas as pd

students = pd.DataFrame({
    "roll": [101, 102, 103, 104, 105, 106, 107, 108],
    "name": ["Asha", "Ravi", "Neha", "Arjun", "Sara", "Vikram", "Meera", "Kabir"],
    "branch": ["CSE", "ECE", "CSE", "ME", "IT", "ECE", "CSE", "ME"],
    "cgpa": [8.9, 7.2, 8.1, 6.8, 9.1, 7.9, 7.4, 7.0],
})
print(students.groupby("branch")["cgpa"].mean().round(2))
print(students.groupby("branch").agg(students=("roll", "count"), avg_cgpa=("cgpa", "mean"), best=("cgpa", "max")).round(2))
branch
CSE    8.13
ECE    7.55
IT     9.10
ME     6.90
Name: cgpa, dtype: float64
        students  avg_cgpa  best
branch
CSE            3      8.13   8.9
ECE            2      7.55   7.9
IT             1      9.10   9.1
ME             2      6.90   7.0
Named aggregations (new_name=("column", "function")) give clear column names — use them in reports.
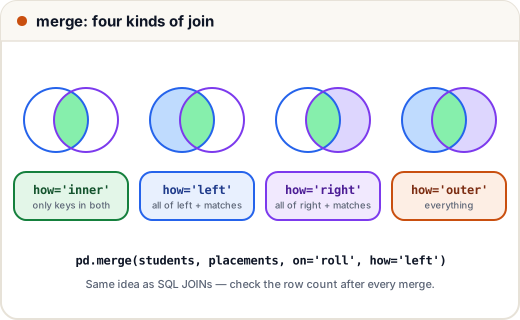
2. merge: joining two tables
import pandas as pd

students = pd.DataFrame({
    "roll": [101, 102, 103, 104, 105, 106, 107, 108],
    "name": ["Asha", "Ravi", "Neha", "Arjun", "Sara", "Vikram", "Meera", "Kabir"],
    "branch": ["CSE", "ECE", "CSE", "ME", "IT", "ECE", "CSE", "ME"],
})
offers = pd.DataFrame({
    "roll": [101, 103, 105, 106, 101, 109],
    "company": ["Infosys", "TCS", "Zoho", "Wipro", "Amazon", "Infosys"],
    "package_lpa": [3.6, 3.4, 8.0, 3.5, 18.0, 3.6],
})
inner = students.merge(offers, on="roll", how="inner")
left = students.merge(offers, on="roll", how="left")
print(len(students), len(offers), len(inner), len(left))
print(inner[["name", "company", "package_lpa"]])
print(left[left["company"].isna()]["name"].tolist())   # students with no offer yet
8 6 5 9
     name  company  package_lpa
0    Asha  Infosys          3.6
1    Asha   Amazon         18.0
2    Neha      TCS          3.4
3    Sara     Zoho          8.0
4  Vikram    Wipro          3.5
['Ravi', 'Arjun', 'Meera', 'Kabir']
Read the row counts carefully:
- Inner has 5 rows: Asha appears twice (two offers), and roll 109 (not in the students table — a data problem to report!) disappears.
- Left keeps all 8 students plus Asha's extra row = 9 rows; students without offers have empty (NaN) company.
Always check len() before and after a merge — duplicate keys silently multiply rows.
3. Building the report
import pandas as pd

students = pd.DataFrame({
    "roll": [101, 102, 103, 104, 105, 106, 107, 108],
    "branch": ["CSE", "ECE", "CSE", "ME", "IT", "ECE", "CSE", "ME"],
})
offers = pd.DataFrame({
    "roll": [101, 103, 105, 106, 101, 109],
    "company": ["Infosys", "TCS", "Zoho", "Wipro", "Amazon", "Infosys"],
    "package_lpa": [3.6, 3.4, 8.0, 3.5, 18.0, 3.6],
})
best = offers.groupby("roll", as_index=False)["package_lpa"].max()      # one row per student: best offer
report = students.merge(best, on="roll", how="left")
report["placed"] = report["package_lpa"].notna()
summary = report.groupby("branch").agg(
    students=("roll", "count"),
    placed=("placed", "sum"),
    avg_best_lpa=("package_lpa", "mean"),
)
summary["placement_rate_%"] = (summary["placed"] / summary["students"] * 100).round(0)
print(summary.round(1).sort_values("placement_rate_%", ascending=False))
        students  placed  avg_best_lpa  placement_rate_%
branch
IT             1       1           8.0             100.0
CSE            3       2          10.7              67.0
ECE            2       1           3.5              50.0
ME             2       0           NaN               0.0
Key decision: we kept each student's best offer before joining, so Asha isn't counted twice. Average package uses only placed students (mean skips NaN) — say so in the report.
4. Pivot tables
import pandas as pd

offers = pd.DataFrame({
    "branch": ["CSE", "CSE", "IT", "ECE", "CSE", "ECE"],
    "company": ["Infosys", "TCS", "Zoho", "Wipro", "Amazon", "Infosys"],
    "package_lpa": [3.6, 3.4, 8.0, 3.5, 18.0, 3.6],
})
table = offers.pivot_table(index="company", columns="branch", values="package_lpa", aggfunc="count", fill_value=0)
print(table)
branch   CSE  ECE  IT
company
Amazon     1    0   0
Infosys    1    1   0
TCS        1    0   0
Wipro      0    1   0
Zoho       0    0   1
A pivot table is groupby on two keys, laid out as a grid — exactly like Excel's pivot table.
Common mistakes
- Merging on a key that isn't unique on either side → rows multiply; check
len(). - Using
meanon a column with NaN and forgetting it skips them. groupbythen forgettingas_index=False/reset_index()when you need a normal table back.
Quick recap
groupby(key).agg(name=(col, func))for grouped summaries.merge(on=..., how="inner"|"left"|"right"|"outer")= SQL joins; check row counts.- Reduce duplicates (e.g. best offer per student) before joining.
pivot_table= groupby on two keys as a grid.