Python for Data Science & Machine Learning · Lesson 1 of 12 · Updated ·
What is Data Science? Roles, the Lifecycle and the Python Toolkit
Every app you use is collecting data: what you search, what you order, when you stop watching a video. Data science is turning that data into decisions — which product to show you, which loan to approve, which student needs help before the exam.
1. Who does what?
| Role | Day-to-day work | Main tools |
|---|---|---|
| Data analyst | answers business questions with SQL, dashboards and charts | SQL, Excel, pandas, Power BI / Tableau |
| Data scientist | builds and tests models, runs experiments, explains results | Python, pandas, statistics, scikit-learn |
| ML engineer | puts models into production, keeps them fast and reliable | Python, APIs, Docker, cloud, MLOps |
| Data engineer | builds the pipelines that move and store data | SQL, Spark, Airflow, cloud warehouses |
For freshers, data analyst is the most common entry point; good Python and statistics then open the data scientist route.
2. The lifecycle
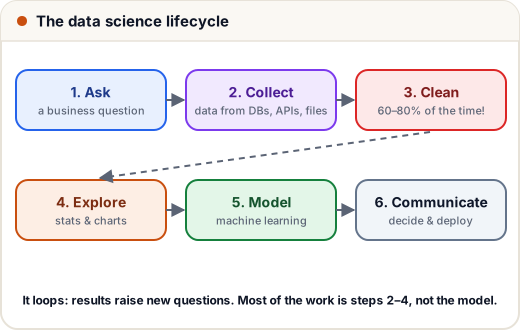
The most surprising fact for beginners: cleaning and understanding the data takes most of the time, not the machine-learning model. A simple model on clean, well-understood data beats a fancy model on messy data.
3. Case study: "Why are our deliveries late?"
(A realistic scenario — the kind of task analysts get in their first month.)
A food-delivery startup in Jaipur sees more 1-star ratings. The operations head asks: why are deliveries late, and what should we change?
- Ask — turn the vague worry into measurable questions: what share of orders arrive more than 10 minutes after the promised time? Does it depend on the restaurant, the area, the hour, the weather?
- Collect — order times, promised times, delivery-partner locations, restaurant preparation times, rain data.
- Clean — remove test orders, fix time zones, handle orders with missing delivery times.
- Explore — group late orders by hour and area; plot them. Pattern: most late orders are 7–9 pm from three restaurants whose food takes 25+ minutes to prepare.
- Model — predict preparation time per restaurant and hour, so the app promises realistic times.
- Communicate — one chart and one recommendation: "Show the predicted time, and ask these three restaurants to start orders earlier at dinner time."
Notice that steps 2–4 found the answer; the model only improved it. You will do every one of these steps in this track.
4. The Python toolkit
| Library | For |
|---|---|
| NumPy | fast arrays and maths |
| pandas | tables (DataFrames): load, clean, group, join |
| matplotlib | charts |
| scikit-learn | machine learning |
| Jupyter | notebooks: code, output and notes in one document |
Install once (Python 3.11+ recommended):
pip install numpy pandas matplotlib scikit-learn jupyterlab
jupyter lab
Or use Google Colab in the browser — free, nothing to install, and everything in this track runs there.
This track uses pandas 3 and NumPy 2, the current versions. Some defaults changed from older tutorials (for example, text columns now have their own str type), and we point those out as we go.
5. A first taste
import pandas as pd

orders = pd.DataFrame({
    "restaurant": ["Spice Hut", "Dosa Point", "Spice Hut", "Biryani Bros", "Dosa Point"],
    "minutes_late": [12, 0, 18, 3, 1],
})
print(orders.groupby("restaurant")["minutes_late"].mean())
restaurant
Biryani Bros     3.0
Dosa Point       0.5
Spice Hut       15.0
Name: minutes_late, dtype: float64
Five lines answer "which restaurant is late most often?" — that is the power you are learning.
Common mistakes
- Starting with the model instead of the question and the data.
- Trusting data without checking it (duplicates, missing values, wrong units).
- Reporting numbers without a clear recommendation.
Quick recap
- Analysts answer questions; scientists build models; ML engineers ship them; data engineers move the data.
- Lifecycle: ask → collect → clean → explore → model → communicate (and repeat).
- Toolkit: NumPy, pandas, matplotlib, scikit-learn, Jupyter or Colab.