Python for Data Science & Machine Learning · Lesson 3 of 12 · Updated ·
pandas Basics — DataFrames, Reading CSV, Selecting, Filtering and Sorting
pandas is Excel for programmers: tables you can load, clean, filter and summarise with code — repeatable, and fine with millions of rows.
1. Loading data
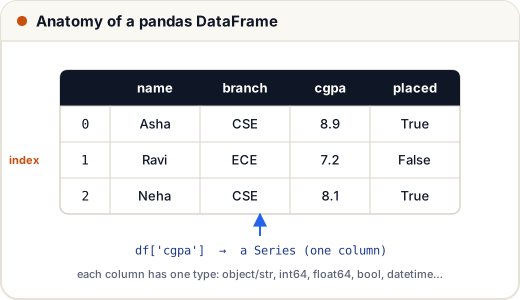
Real data usually comes from a CSV file (pd.read_csv("students.csv")), Excel (pd.read_excel) or a database (pd.read_sql). To keep these examples self-contained we read CSV text from a string — the code is identical for a file:
import io
import pandas as pd

csv = """name,branch,cgpa,backlogs,city
Asha,CSE,8.9,0,Jaipur
Ravi,ECE,7.2,1,Pune
Neha,CSE,8.1,0,Pune
Arjun,ME,6.8,2,Jaipur
Sara,IT,9.1,0,Bengaluru
Vikram,ECE,7.9,0,Jaipur"""
df = pd.read_csv(io.StringIO(csv))     # for a real file: pd.read_csv("students.csv")

print(df.head(3))
print(df.shape)
print(df.dtypes)
   name branch  cgpa  backlogs    city
0  Asha    CSE   8.9         0  Jaipur
1  Ravi    ECE   7.2         1    Pune
2  Neha    CSE   8.1         0    Pune
(6, 5)
name            str
branch          str
cgpa        float64
backlogs      int64
city            str
dtype: object
pandas 3: text columns now get the dedicated
strdtype instead of the old catch-allobject. Older tutorials and Stack Overflow answers still showobject.
2. Getting to know the data
import io
import pandas as pd

csv = """name,branch,cgpa,backlogs,city
Asha,CSE,8.9,0,Jaipur
Ravi,ECE,7.2,1,Pune
Neha,CSE,8.1,0,Pune
Arjun,ME,6.8,2,Jaipur
Sara,IT,9.1,0,Bengaluru
Vikram,ECE,7.9,0,Jaipur"""
df = pd.read_csv(io.StringIO(csv))

print(df["cgpa"].describe().round(2))
print(df["city"].value_counts())
count    6.00
mean     8.00
std      0.91
min      6.80
25%      7.38
50%      8.00
75%      8.70
max      9.10
Name: cgpa, dtype: float64
city
Jaipur       3
Pune         2
Bengaluru    1
Name: count, dtype: int64
describe() gives count, mean, spread and quartiles in one line; value_counts() counts categories. Run both on every new dataset.
3. Selecting: columns, loc and iloc
import io
import pandas as pd

csv = """name,branch,cgpa,backlogs,city
Asha,CSE,8.9,0,Jaipur
Ravi,ECE,7.2,1,Pune
Neha,CSE,8.1,0,Pune
Arjun,ME,6.8,2,Jaipur
Sara,IT,9.1,0,Bengaluru
Vikram,ECE,7.9,0,Jaipur"""
df = pd.read_csv(io.StringIO(csv))

print(df[["name", "cgpa"]].head(2))   # list of columns → DataFrame
print(df.loc[2, "name"])                # loc: by LABEL (index label 2, column "name")
print(df.iloc[0, 2])                    # iloc: by POSITION (row 0, column 2)
print(df.loc[df["cgpa"] > 8, ["name", "branch"]])   # rows by condition, chosen columns
   name  cgpa
0  Asha   8.9
1  Ravi   7.2
Neha
8.9
   name branch
0  Asha    CSE
2  Neha    CSE
4  Sara     IT
loc = labels, iloc = integer positions. With the default index (0, 1, 2…) they look similar — after sorting or filtering they are not.
4. Filtering with conditions
import io
import pandas as pd

csv = """name,branch,cgpa,backlogs,city
Asha,CSE,8.9,0,Jaipur
Ravi,ECE,7.2,1,Pune
Neha,CSE,8.1,0,Pune
Arjun,ME,6.8,2,Jaipur
Sara,IT,9.1,0,Bengaluru
Vikram,ECE,7.9,0,Jaipur"""
df = pd.read_csv(io.StringIO(csv))

eligible = df[(df["cgpa"] >= 7.5) & (df["backlogs"] == 0)]   # & = and, | = or; brackets are required
print(eligible["name"].tolist())
print(df[df["city"].isin(["Pune", "Bengaluru"])]["name"].tolist())
print(df.query("branch == 'CSE' and cgpa > 8.5")["name"].tolist())
['Asha', 'Neha', 'Sara', 'Vikram']
['Ravi', 'Neha', 'Sara']
['Asha']
Case: a company visiting campus wants "CGPA ≥ 7.5 and no backlogs" — the placement cell's whole shortlist is that one line.
5. Sorting and new columns
import io
import pandas as pd

csv = """name,branch,cgpa,backlogs,city
Asha,CSE,8.9,0,Jaipur
Ravi,ECE,7.2,1,Pune
Neha,CSE,8.1,0,Pune
Arjun,ME,6.8,2,Jaipur
Sara,IT,9.1,0,Bengaluru
Vikram,ECE,7.9,0,Jaipur"""
df = pd.read_csv(io.StringIO(csv))

df["percent"] = (df["cgpa"] * 9.5).round(1)          # a whole column at once
df["eligible"] = (df["cgpa"] >= 7.5) & (df["backlogs"] == 0)
top = df.sort_values(["eligible", "cgpa"], ascending=[False, False])
print(top[["name", "cgpa", "percent", "eligible"]].to_string(index=False))
  name  cgpa  percent  eligible
  Sara   9.1     86.4      True
  Asha   8.9     84.6      True
  Neha   8.1     77.0      True
Vikram   7.9     75.0      True
  Ravi   7.2     68.4     False
 Arjun   6.8     64.6     False
(The ×9.5 rule is just an example — each university has its own conversion; see our CGPA tool.)
Common mistakes
df[df["cgpa"] > 7 and df["backlogs"] == 0]— use&/|with brackets, notand/or.- Mixing up
loc(labels) andiloc(positions). - Not looking at
shape,dtypes,describe()before analysing.
Quick recap
pd.read_csv→ DataFrame; inspect withhead,shape,dtypes,describe,value_counts.- Select columns with
df[["a", "b"]]; rows withloc(labels) oriloc(positions). - Filter with boolean conditions combined by
&and|, orquery. sort_values, and create columns with vectorised expressions.