Python for Data Science & Machine Learning · Lesson 9 of 12 · Updated ·
Classification — Logistic Regression, Decision Trees, Confusion Matrix, Precision and Recall
Regression predicts numbers; classification predicts categories: placed or not, spam or not, which loan is risky. It is the most common kind of ML at work.
Case study: early placement support
A college wants to find, in the third year, students at risk of not being placed, so mentors can help early. A model that flags students is useful only if it finds most at-risk students (they get help) without flagging everyone (mentors have limited time).
1. The data and two models
import numpy as np
import pandas as pd
from sklearn.linear_model import LogisticRegression
from sklearn.model_selection import train_test_split
from sklearn.tree import DecisionTreeClassifier

rng = np.random.default_rng(7)
n = 400
df = pd.DataFrame({
    "cgpa": rng.normal(7.5, 0.9, n).clip(5, 10).round(2),
    "internships": rng.integers(0, 3, n),
    "projects": rng.integers(0, 5, n),
    "aptitude": rng.normal(65, 12, n).clip(20, 100).round(),
})
score = 1.4 * (df["cgpa"] - 7.5) + 0.8 * df["internships"] + 0.35 * df["projects"] + 0.05 * (df["aptitude"] - 65) + rng.normal(0, 0.8, n)
df["placed"] = (score > 0.3).astype(int)
print(df["placed"].value_counts())

X, y = df[["cgpa", "internships", "projects", "aptitude"]], df["placed"]
X_train, X_test, y_train, y_test = train_test_split(X, y, test_size=0.25, random_state=0, stratify=y)

logreg = LogisticRegression(max_iter=1000).fit(X_train, y_train)
tree = DecisionTreeClassifier(max_depth=3, random_state=0).fit(X_train, y_train)
print("logistic regression accuracy:", round(logreg.score(X_test, y_test), 3))
print("decision tree accuracy:      ", round(tree.score(X_test, y_test), 3))

student = pd.DataFrame([{"cgpa": 7.0, "internships": 0, "projects": 1, "aptitude": 55}])
print("chance of placement:", logreg.predict_proba(student)[0, 1].round(2))
placed
1    290
0    110
Name: count, dtype: int64
logistic regression accuracy: 0.79
decision tree accuracy:       0.76
chance of placement: 0.12
- Logistic regression outputs a probability (
predict_proba), then uses 0.5 as the default cut-off. Despite its name it's a classification model. - A decision tree learns if/else questions ("cgpa ≤ 7.2? internships ≤ 0?…").
max_depth=3keeps it small and readable. stratify=ykeeps the same placed/not-placed ratio in train and test.
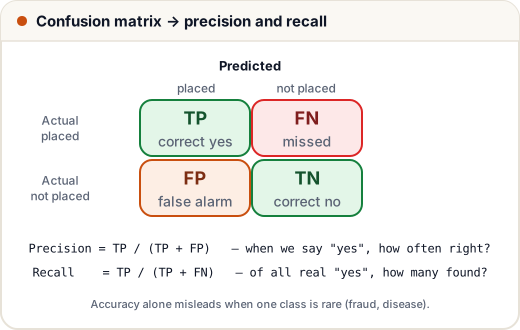
2. The confusion matrix
import numpy as np
import pandas as pd
from sklearn.linear_model import LogisticRegression
from sklearn.metrics import classification_report, confusion_matrix
from sklearn.model_selection import train_test_split

rng = np.random.default_rng(7)
n = 400
df = pd.DataFrame({
    "cgpa": rng.normal(7.5, 0.9, n).clip(5, 10).round(2),
    "internships": rng.integers(0, 3, n),
    "projects": rng.integers(0, 5, n),
    "aptitude": rng.normal(65, 12, n).clip(20, 100).round(),
})
score = 1.4 * (df["cgpa"] - 7.5) + 0.8 * df["internships"] + 0.35 * df["projects"] + 0.05 * (df["aptitude"] - 65) + rng.normal(0, 0.8, n)
df["at_risk"] = (score <= 0.3).astype(int)          # 1 = NOT placed: the class we want to find
X, y = df[["cgpa", "internships", "projects", "aptitude"]], df["at_risk"]
X_train, X_test, y_train, y_test = train_test_split(X, y, test_size=0.25, random_state=0, stratify=y)

model = LogisticRegression(max_iter=1000).fit(X_train, y_train)
pred = model.predict(X_test)
print(confusion_matrix(y_test, pred))               # rows = actual 0/1, columns = predicted 0/1
print(classification_report(y_test, pred, target_names=["placed", "at risk"], digits=2))
[[68  5]
 [13 14]]
              precision    recall  f1-score   support

      placed       0.84      0.93      0.88        73
     at risk       0.74      0.52      0.61        27

    accuracy                           0.82       100
   macro avg       0.79      0.73      0.75       100
weighted avg       0.81      0.82      0.81       100
For the at-risk row:
- Precision — of the students we flagged, how many really were at risk? (Mentor time well spent.)
- Recall — of all truly at-risk students, how many did we flag? (Nobody left behind.)
- F1 — one number balancing both.
3. Moving the threshold
import numpy as np
import pandas as pd
from sklearn.linear_model import LogisticRegression
from sklearn.metrics import precision_score, recall_score
from sklearn.model_selection import train_test_split

rng = np.random.default_rng(7)
n = 400
df = pd.DataFrame({
    "cgpa": rng.normal(7.5, 0.9, n).clip(5, 10).round(2),
    "internships": rng.integers(0, 3, n),
    "projects": rng.integers(0, 5, n),
    "aptitude": rng.normal(65, 12, n).clip(20, 100).round(),
})
score = 1.4 * (df["cgpa"] - 7.5) + 0.8 * df["internships"] + 0.35 * df["projects"] + 0.05 * (df["aptitude"] - 65) + rng.normal(0, 0.8, n)
df["at_risk"] = (score <= 0.3).astype(int)
X, y = df[["cgpa", "internships", "projects", "aptitude"]], df["at_risk"]
X_train, X_test, y_train, y_test = train_test_split(X, y, test_size=0.25, random_state=0, stratify=y)
proba = LogisticRegression(max_iter=1000).fit(X_train, y_train).predict_proba(X_test)[:, 1]

for threshold in (0.7, 0.5, 0.3):
    flagged = (proba >= threshold).astype(int)
    print(f"threshold {threshold}: flagged {flagged.sum():3d}  precision {precision_score(y_test, flagged):.2f}  recall {recall_score(y_test, flagged):.2f}")
threshold 0.7: flagged   7  precision 0.86  recall 0.22
threshold 0.5: flagged  19  precision 0.74  recall 0.52
threshold 0.3: flagged  25  precision 0.76  recall 0.70
Lowering the threshold flags more students and recall rises — from 0.22 to 0.70 here. Precision usually falls as you flag more; in this run it drops from 0.86 at 0.7 and then stays around 0.75, because the extra students flagged at 0.3 are mostly real at-risk cases. The right threshold is a business decision: for early mentoring, missing a student is worse than an extra conversation, so we'd pick a lower threshold. For fraud alerts that freeze a customer's card, false alarms are costly — a higher threshold.
4. The accuracy trap (imbalanced data)
If only 2% of transactions are fraud, a model that says "never fraud" is 98% accurate — and completely useless. With rare classes, look at precision, recall and the confusion matrix, not accuracy. Options: class_weight="balanced", collecting more examples of the rare class, or tuning the threshold as above.
Common mistakes
- Judging a classifier by accuracy alone on imbalanced data.
- Forgetting
stratify=yon small datasets. - Deep, unlimited decision trees that memorise the training data (next lesson).
- Treating 0.5 as a law — choose the threshold from the cost of each kind of mistake.
Quick recap
- Classification predicts categories; logistic regression gives probabilities; trees give if/else rules.
- Confusion matrix → precision (are flags right?) and recall (did we find them all?), F1 balances them.
- The threshold trades precision against recall — decide it from business costs.
- Accuracy misleads when classes are imbalanced.