Python for Data Science & Machine Learning · Lesson 12 of 12 · Updated ·
End-to-End Data Science Project and Interview Questions
Employers hire people who can take a vague question all the way to a decision. Here is the whole journey in one script — the kind of project to put on GitHub.
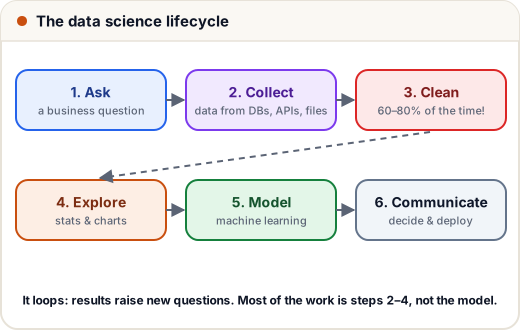
1. The project
Question (from the placement cell): "Which third-year students should get extra mentoring, and what matters most for placement?"
import joblib
import numpy as np
import pandas as pd
from sklearn.compose import ColumnTransformer
from sklearn.ensemble import RandomForestClassifier
from sklearn.metrics import classification_report
from sklearn.model_selection import train_test_split
from sklearn.pipeline import Pipeline
from sklearn.preprocessing import OneHotEncoder

# --- 1. collect (simulated, reproducible practice data) ---
rng = np.random.default_rng(21)
n = 600
df = pd.DataFrame({
    "cgpa": rng.normal(7.4, 0.9, n).clip(5, 10).round(2),
    "internships": rng.integers(0, 3, n),
    "projects": rng.integers(0, 5, n),
    "aptitude": rng.normal(63, 12, n).clip(20, 100).round(),
    "branch": rng.choice(["CSE", "IT", "ECE", "ME"], n, p=[0.35, 0.2, 0.25, 0.2]),
})
bonus = df["branch"].map({"CSE": 0.4, "IT": 0.3, "ECE": 0.0, "ME": -0.3})
score = 1.4 * (df["cgpa"] - 7.4) + 0.8 * df["internships"] + 0.35 * df["projects"] + 0.05 * (df["aptitude"] - 63) + bonus + rng.normal(0, 0.8, n)
df["placed"] = (score > 0.3).astype(int)
df.loc[rng.choice(n, 15, replace=False), "aptitude"] = np.nan        # real data has gaps

# --- 2. clean ---
df["aptitude"] = df["aptitude"].fillna(df["aptitude"].median())
print("rows:", len(df), "| placed rate:", round(df["placed"].mean(), 3))

# --- 3. explore ---
print(df.groupby("internships")["placed"].mean().round(2))

# --- 4. model ---
features = ["cgpa", "internships", "projects", "aptitude", "branch"]
X_train, X_test, y_train, y_test = train_test_split(df[features], df["placed"], test_size=0.25, random_state=0, stratify=df["placed"])
pipe = Pipeline([
    ("prepare", ColumnTransformer([("branch", OneHotEncoder(handle_unknown="ignore"), ["branch"])], remainder="passthrough")),
    ("model", RandomForestClassifier(n_estimators=200, max_depth=5, random_state=0)),
])
pipe.fit(X_train, y_train)
print(classification_report(y_test, pipe.predict(X_test), target_names=["not placed", "placed"], digits=2))

# --- what matters most? ---
names = pipe.named_steps["prepare"].get_feature_names_out()
importance = pd.Series(pipe.named_steps["model"].feature_importances_, index=names).sort_values(ascending=False)
print(importance.round(3).head(5))

# --- 5. save the whole pipeline for reuse in an app or API ---
joblib.dump(pipe, "placement_model.joblib")
third_years = pd.DataFrame([
    {"cgpa": 6.6, "internships": 0, "projects": 1, "aptitude": 50, "branch": "ME"},
    {"cgpa": 8.4, "internships": 1, "projects": 3, "aptitude": 72, "branch": "CSE"},
])
chance = joblib.load("placement_model.joblib").predict_proba(third_years)[:, 1]
print("placement chance:", chance.round(2))
rows: 600 | placed rate: 0.778
internships
0    0.62
1    0.83
2    0.88
Name: placed, dtype: float64
              precision    recall  f1-score   support

  not placed       0.89      0.48      0.63        33
      placed       0.87      0.98      0.92       117

    accuracy                           0.87       150
   macro avg       0.88      0.73      0.78       150
weighted avg       0.88      0.87      0.86       150

remainder__cgpa           0.485
remainder__aptitude       0.210
remainder__internships    0.137
remainder__projects       0.116
branch__branch_ME         0.015
dtype: float64
placement chance: [0.19 0.96]
Random forest = many decision trees voting; usually more accurate and stable than a single tree, and it reports feature importances (the remainder__ prefix just means "a column passed through the ColumnTransformer unchanged").
Read the results honestly: the model finds 98% of placed students but only 48% of the not-placed ones (recall) — for a mentoring programme we'd lower the threshold, as in the classification lesson.
2. Communicate: the one paragraph that matters
"Using last year's data, our model estimates each student's chance of placement. CGPA matters most, followed by aptitude scores and internships. Students with no internship were placed 62% of the time, versus 83–88% with one or two. We recommend mentoring students the model scores below 50% (like the first student above, at 19%), running aptitude practice from the third year, and helping every student get at least one internship before the final year."
A clear recommendation, backed by one chart and the model's limits ("simulated data; check on real records before acting"), is worth more than the most complex model.
3. Make it a portfolio project
- Put the notebook/script, a
README.md(question, data, method, results, limits) and a chart on GitHub. - Turn the saved pipeline into a small API (see our Spring Boot or Python FastAPI) or a Streamlit app.
- Use a real public dataset (Kaggle, data.gov.in) for your own version.
4. Interview questions — short answers
- Supervised vs unsupervised? Labelled examples (regression, classification) vs finding structure without labels (clustering, PCA).
- Regression vs classification? Predict a number vs a category.
- Overfitting and how to fix it? Great on training, poor on new data. Simpler model, more data, regularisation, cross-validation, early stopping.
- Bias vs variance? Bias = too simple (underfits); variance = too sensitive to the training data (overfits). Good models balance both.
- Precision vs recall? Flags that are right vs real cases found. Choose from the cost of false positives vs false negatives.
- Why not accuracy on imbalanced data? Predicting the majority class gives high accuracy and no value.
- What is cross-validation? Train/test on several folds and average for a stable estimate.
- What is data leakage? Test or future information in training — e.g. scaling before the split.
- How do you handle missing values? Understand why they're missing; drop, impute (median/mode/group), or flag.
- Mean vs median? Median for skewed data (salaries).
- Correlation vs causation? Moving together ≠ one causing the other; confounders; experiments (A/B tests) show causation.
- What is a p-value? The probability of a result at least this extreme if there were no real effect.
- Logistic regression — regression or classification? Classification: it outputs probabilities.
- Decision tree vs random forest? One tree is interpretable but unstable; a forest averages many trees for accuracy.
- Why scale features? Distance- and gradient-based models are distorted by different units.
- How do you choose k in k-means? Elbow/silhouette plus business usefulness.
- What does R² mean? Share of the target's variation explained by the model.
- pandas: loc vs iloc? Labels vs positions.
- merge vs concat? Join on keys vs stack tables.
- Explain a project. Question → data → cleaning → exploration → model → evaluation → recommendation → limits.
Common mistakes
- A notebook with no question, no conclusion and no README.
- Reporting only accuracy.
- Not stating the data's limits.
Quick recap
- A full project: ask, collect, clean, explore, model (pipeline), evaluate, explain, save.
- Random forests give strong baselines and feature importances.
- Communicate one clear recommendation with limits.
- Revise the 20 questions above with examples from your own project.